Businesses are submerged in a sea of data in today’s digital landscape. This wealth of information has the potential to drive growth and innovation, but making sense of it can be a daunting task. This is where the magic of data visualization comes into play. These dynamic platforms can take intricate data and present it in a visual format that is easy to comprehend and offers actionable insights.
The Essence of Data Visualization
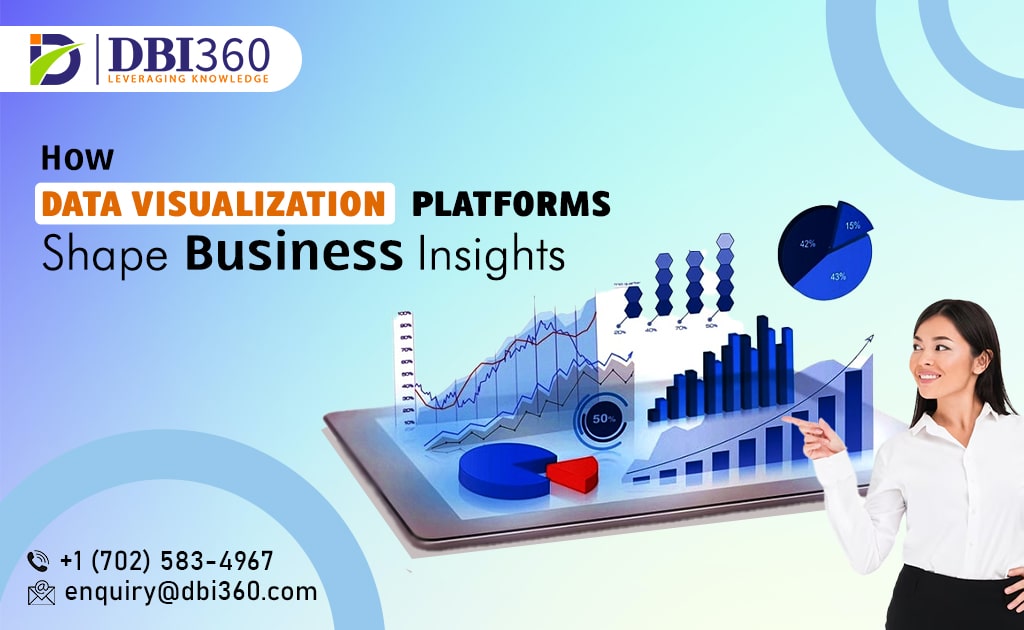
Imagine poring over spreadsheets of numbers and figures, struggling to decipher their significance. Now picture those exact figures transformed into interactive graphs, charts, and diagrams. The difference is like night and day. Data visualization takes complex data and translates it into visuals that make it accessible to anyone – from experts to novices. By visually representing data, these platforms unlock hidden patterns and correlations that might go unnoticed.
Unveiling the Benefits
The advantages of utilizing data visualization platforms are vast and cater to businesses of all sizes and industries:
Clarity and Insight: Visualized data clarifies its meaning, helping stakeholders grasp the essence of trends, patterns, and outliers.
Informed Decision-Making: Quick decisions are essential in today’s fast-paced business world. Data visualization grants rapid access to crucial information, empowering decision-makers with actionable insights.
Engagement: Visuals capture attention. They draw the audience in and make data more memorable, ensuring the information sticks and resonates.
Spotting Trends: Recognizing trends within data is crucial for future planning. Visualization tools make trends immediately apparent, saving time and guiding strategic actions.
Applications in Business
The versatility of data visualization platforms is far-reaching, transforming how businesses operate across sectors:
Sales and Marketing: Visualizing customer demographics, sales trends, and campaign performance aids marketers in data-driven decision-making.
Finance: Transforming financial data into visual reports assists in budget allocation, expense tracking, and ROI analysis.
Operations: By visualizing supply chain data, production metrics, and resource allocation, operational inefficiencies are easily identified and addressed.
Human Resources: Visualizations help HR (Human Resources) professionals manage employee performance, attrition rates, and skill gaps effectively.
Business Intelligence: Interactive dashboards provide a comprehensive view of business performance, empowering leaders with actionable insights.
Choosing the Right Platform
Selecting the ideal data visualization platform is a pivotal choice. Consider factors such as:
Features: Opt for platforms offering customized charts, graphs, and interactive dashboards to suit your needs.
Integration: Ensure the platform seamlessly merges with your existing data sources and systems for a harmonious data environment.
Scalability: As your business grows, so does your data. Choose a platform capable of handling increasing data volumes without compromising performance.
User-Friendliness: An intuitive interface is vital for swift adoption. Your team should be able to create and interpret visuals without a steep learning curve.
Emerging Trends
Data visualization continues to evolve, incorporating innovative technologies:
AI-Driven Insights: Artificial intelligence enhances data visualization with predictive analytics, offering deeper insights and foresight.
Interactive Storytelling: Merging data visualization with narratives creates compelling presentations that resonate with audiences.
Augmented Reality: AR enriches data exploration by providing immersive experiences, enabling stakeholders to interact with data in new dimensions.
Challenges and Solutions
Despite the benefits, challenges such as data security, scalability, and accurate representation can arise. To address these, opt for platforms with robust security features, regular updates, and effective data preprocessing techniques.
The Future of Data Visualization
The future holds exciting possibilities for data visualization. As artificial intelligence and machine learning advance, data interpretation will become even more accurate and insightful. Augmented reality will allow users to engage with data in immersive, three-dimensional environments, transforming how insights are gathered and communicated.
Conclusion
Data visualization platforms are not just tools but enablers of deeper data understanding. In a world where data is the currency of success, the ability to transform intricate information into visual stories is priceless. Businesses that embrace data visualization platforms open doors to new realms of growth, innovation, and strategic decision-making.
Step into the forefront of innovation with DBI 360. Discover our tailored dietary Business Intelligence solutions to meet your unique business requirements. Your future begins here.