The way we make decisions has changed significantly in the data-driven world of today. Long gone are the days when business leaders relied solely on intuition and experience. Now, data visualization is at the heart of strategic planning, offering clear and actionable insights. But what exactly is data visualization, and why is it crucial for modern businesses? Let’s dive in and explore how business visualization software is transforming decision-making.
Understanding Data Visualization
At its core, data visualization is the process of translating complex data sets into visual formats like charts, graphs, and maps. This transformation makes it easier for stakeholders to understand patterns, trends, and outliers within the data. The ability to quickly grasp these insights is a game-changer for businesses looking to stay ahead in a competitive market.
The Power of Visual Data
Imagine you’re looking at a spreadsheet filled with numbers. Identifying trends or making sense of the data might feel overwhelming. Now, picture that same data as a colorful graph. Instantly, patterns become visible, and insights emerge. This is the power of data visualization – turning raw data into a story that anyone can understand at a glance.
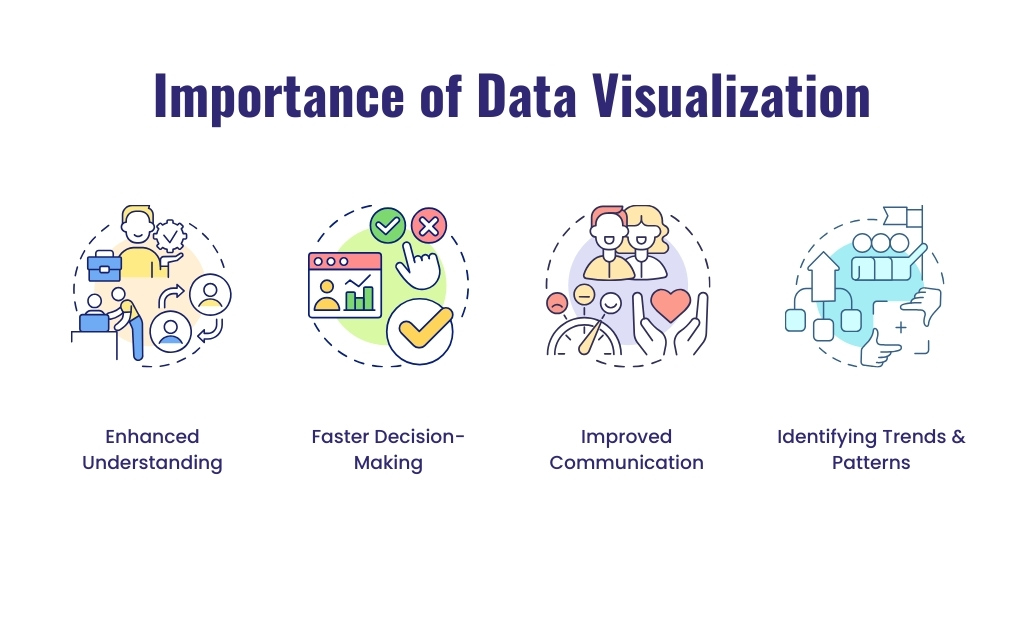
Why Data Visualization Matters
- Enhanced Understanding
- Data visualization simplifies complex data sets, making it easier for everyone, regardless of their technical expertise, to understand and engage with the information.
- Interactive dashboards allow users to drill down into specific data points, fostering a deeper understanding and facilitating better discussions.
- Faster Decision-Making
- With real-time data visualization, businesses can make quicker decisions. Instead of spending hours analyzing data, leaders can view dynamic dashboards that update in real time.
- This speed is particularly crucial in fast-paced industries where timely decisions can make or break success.
- Improved Communication
- Visual data aids in better communication across teams. When everyone is on the same page, it’s easier to align on strategies and objectives.
- Presenting data visually during meetings helps in engaging the audience, ensuring that key points are understood and retained.
- Identifying Trends and Patterns
- Visualization tools help in spotting trends and patterns that might be missed in traditional data analysis. This can lead to new business insights and opportunities.
- Predictive analytics can be enhanced through visualization, helping businesses anticipate market changes and adjust strategies accordingly.
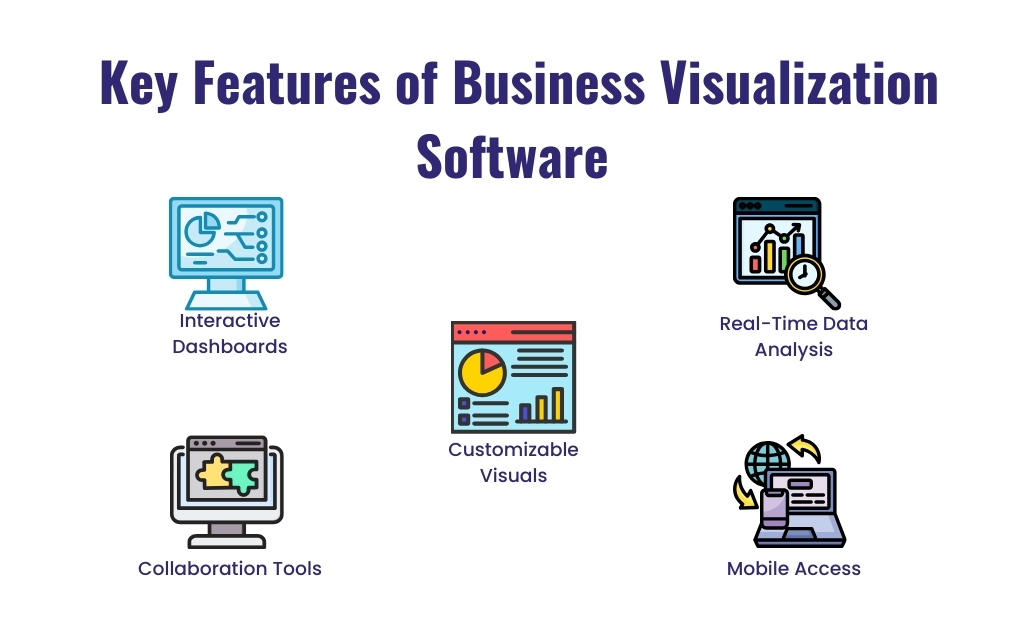
Key Features of Business Visualization Software
- Interactive Dashboards: Customize dashboards to track key performance indicators (KPIs) and other critical metrics. Interactive elements allow users to filter and focus on specific data points.
- Real-Time Data Analysis: Access up-to-the-minute data, enabling timely decisions. This feature is particularly beneficial for industries like finance and retail.
- Customizable Visuals: Tailor charts, graphs, and maps to meet specific business needs. Customization ensures that the most relevant data is highlighted.
- Collaboration Tools: Share dashboards and reports with team members easily. Collaborative tools ensure that insights are accessible to all relevant stakeholders.
- Mobile Access: View and interact with data on the go. Mobile compatibility ensures that decision-makers can access critical information anytime, anywhere.
Real-World Applications
Let’s look at a few examples of how data visualization is used across different industries, including those catered to by DBI360:
- Retail: Companies like Amazon and Walmart use data visualization to track inventory, sales trends, and customer behavior. This helps in optimizing stock levels and personalizing customer experiences.
- Healthcare: Hospitals and clinics utilize visualization tools to monitor patient outcomes, manage resources, and improve operational efficiency.
- Finance: Banks and financial institutions leverage real-time data visualization to track market trends, manage risks, and make investment decisions.
- Marketing: Marketers use visualization to analyze campaign performance, understand customer demographics, and refine targeting strategies.
- Nutraceuticals, Food & Supplement: DBI360 provides tailored visualization solutions to help companies in these sectors track production processes, ensure compliance with health regulations, and manage supply chains efficiently. Real-time data on ingredient sourcing, quality control, and market trends can significantly enhance operational efficiency and strategic planning.
Choosing the Right Data Visualization Tool
With numerous data visualization tools available, choosing the right one can be challenging. Consider the following factors:
- Ease of Use: Look for tools with intuitive interfaces and easy-to-navigate features.
- Integration: Ensure the tool can integrate seamlessly with your existing data sources and systems.
- Scalability: Choose a tool that can grow with your business needs.
- Support and Training: Opt for solutions that offer robust customer support and training resources.
Conclusion
Data visualization is more than just a trend; it’s a fundamental shift in how businesses approach decision-making. By transforming complex data into clear and actionable insights, business visualization software empowers organizations to make informed decisions quickly and effectively. Whether you’re in retail, healthcare, finance, marketing, or the nutraceutical industry, the right data visualization tool can unlock new opportunities and drive success. So, picture this: a future where your business decisions are always backed by clear, visual data insights. That future is now.