In today’s data-driven world, businesses are drowning in information. Gigabytes of data are collected daily, but the true value lies in unlocking the insights hidden within. While raw numbers hold immense potential, they often fail to resonate with audiences. This is where the art of data visualization steps in, transforming complex data sets into compelling narratives that inform, engage, and inspire action.
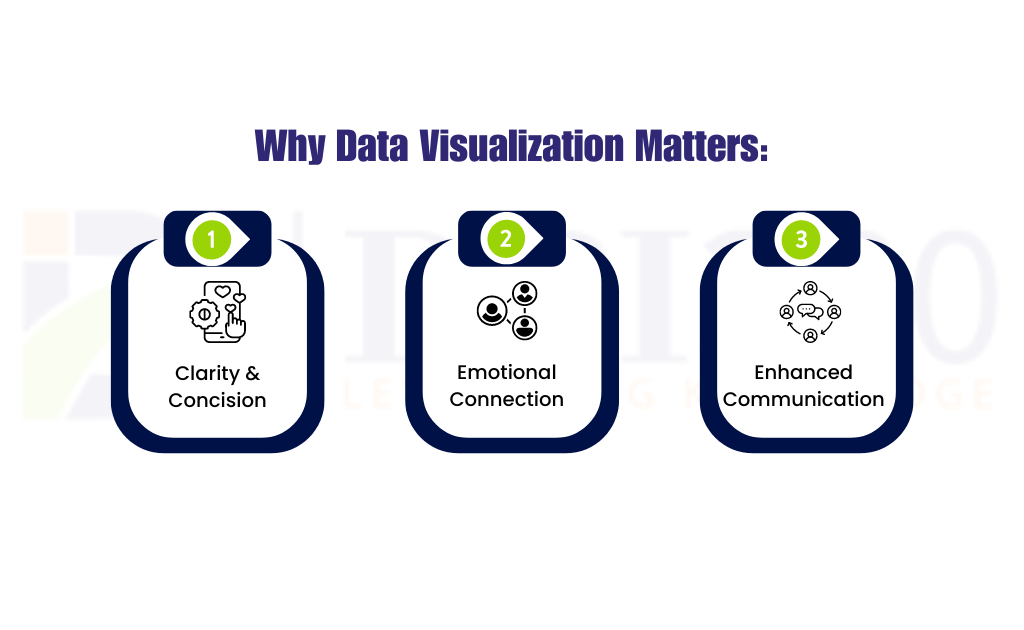
Why Data Visualization Matters:
-
Clarity and Concision: Data visualizations present information in a visually organized and easy-to-understand format. Charts, graphs, and infographics condense complex data sets into digestible chunks, making it easier for audiences to grasp key trends and patterns.
-
Emotional Connection: Humans are visual creatures, and data visualizations leverage this by adding an emotional layer to data analysis. Compelling visuals can spark curiosity, evoke emotions, and leave a lasting impression on viewers.
-
Enhanced Communication: Data visualizations act as a universal language, transcending cultural and linguistic barriers. A well-designed visualization can effectively communicate complex information to a diverse audience, fostering better collaboration and understanding.
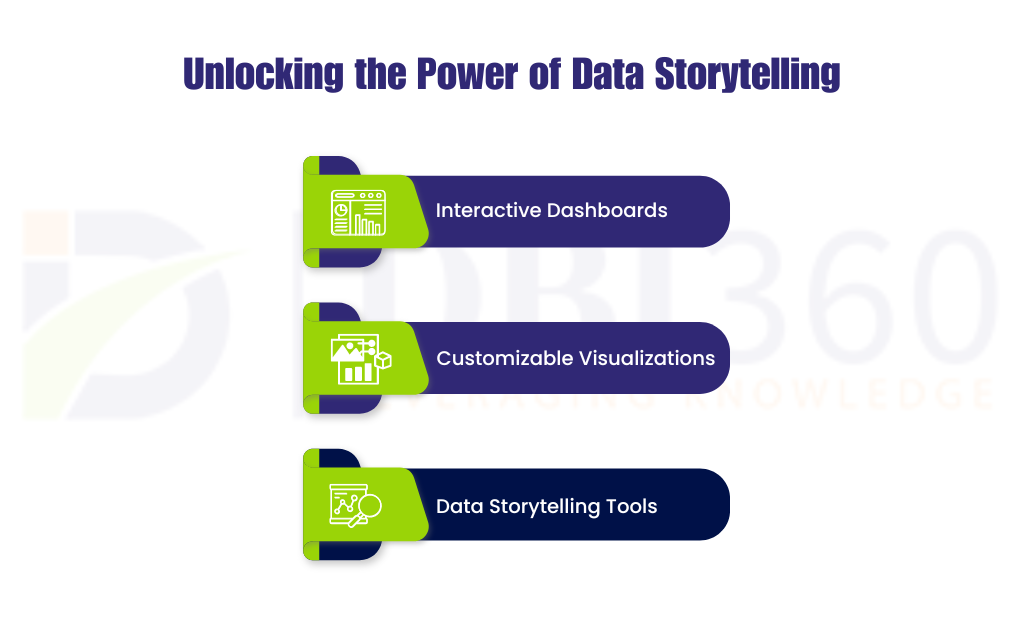
Unlocking the Power of Data Storytelling:
Effective data storytelling goes beyond simply presenting data visually. It’s about crafting a narrative that guides viewers on a journey of discovery, highlighting key insights and prompting action. DBi360’s BI solutions empower you to tell impactful data stories through features like:
-
Interactive Dashboards: Create dynamic dashboards that allow users to explore data from multiple perspectives and uncover hidden patterns.
-
Customizable Visualizations: Tailor your visualizations to best suit the story you’re trying to tell. DBi360 offers a variety of chart types and customization options to ensure maximum impact.
-
Data Storytelling Tools: Embed storytelling elements like annotations and explanations within your visualizations, providing context and guiding viewers through your data journey.
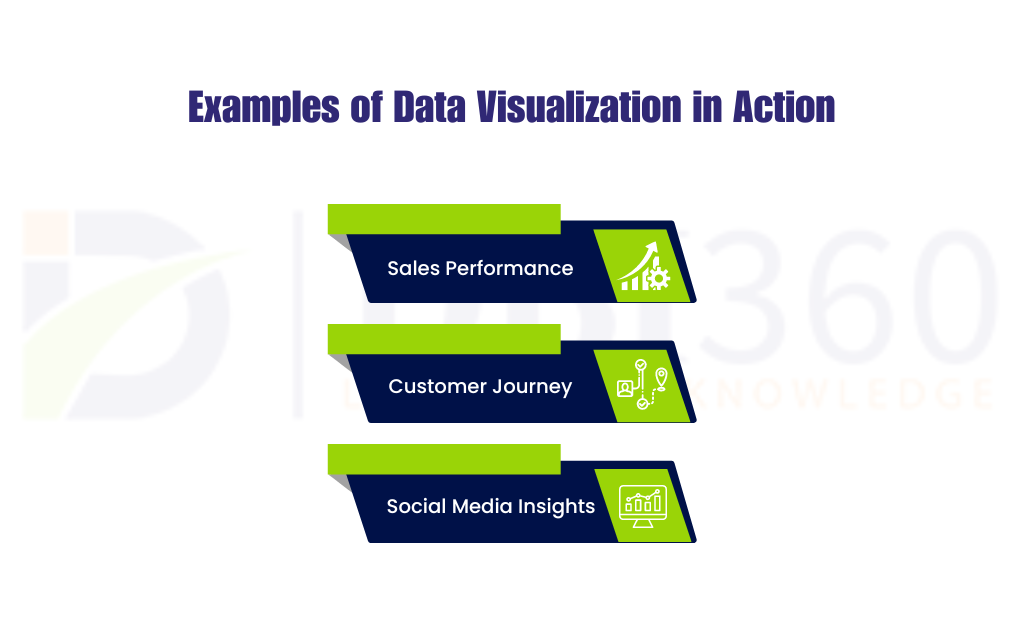
Examples of Data Visualization in Action:
Data visualization can be applied to a wide range of scenarios, from tracking marketing campaign performance to analyzing customer behavior. Here are a few examples:
-
Sales Performance: A bar chart comparing sales figures across different regions allows for quick identification of high-performing and underperforming markets.
-
Customer Journey: A customer journey map visualized through a flow chart can reveal key touchpoints and potential areas for improvement in the customer experience.
-
Social Media Insights: Pie charts and graphs represent social media engagement metrics, enabling businesses to understand audience demographics and preferences.
Conclusion:
Data visualization is a powerful tool that can unlock the true potential of your data. By transforming numbers into narratives, you can effectively communicate insights, drive informed decision-making, and inspire action across your organization.
DBi360 is committed to empowering businesses to harness the power of data visualization. Contact us today to learn more about how our BI solutions can help you transform data into actionable stories that drive success.